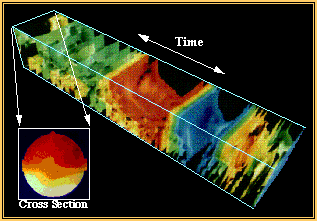
What is a Spatiotemporal Isosurface of P300 Evoked Potential data? The term "spatiotemporal" implies that the data is of a spatially distributed nature rendered as a function of time, as seen in the diagram. "Isosurfaces" are a graphical rendering technique available on the more powerful computer visualization programs like AVS (Application Visualization System, Developed by AVS, Inc.), which creates 2D contours in 3D space by interpolating between stacked sequential datasets, such as the 2D brain maps which comrise a cross section of the 3D data volume. Normally, neurodiagnostic technicians look at a series of 20 or so squiggly lines representing electrical data from the scalp, and must then develop an abstract image in their mind which hopefully, but probably rarely, provides the detail seen in this image. This image was rendered on a Stardent Titan 3000 (MIPS 3000 cpu) using AVS. I wrote some C code which translates the EEG data from a QSI 9000 EEG data acquisition system and conforms it to the required "3D field" format in AVS. |
|
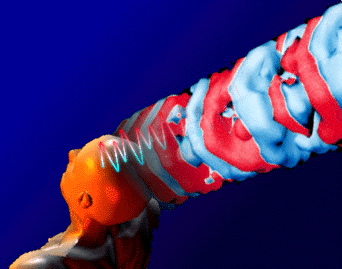
| The image on the right, which we
fondly refer to as "volcano-head", illustrates what you might see if you
could perceive and capture a still image of the electrical information
"flowing" off the scalp. The squiggly line represents EEG from a single
point on the scalp, such as the EEG acquired from a single electrode.
Standard clinical EEG consists of as few as 8 electrodes and as many as
64, distributed across the scalp. This squiggly line from a single data
point and the isosurface itself are color-coded with red corresponding to
higher values in microvolts and blue as the lower values across a range of
about 10-100 microvolts peak-to-peak for normal EEG. In reality, the
electrical activity extends only a short distance (a few mm) from the
scalp before it becomes undetectable. This image is simply intended as
sort of a conceptual graphic for understanding these isosurfaces.
The data in this image is actual alpha EEG from a subject relaxed with their eyes-closed. |

|
 
|
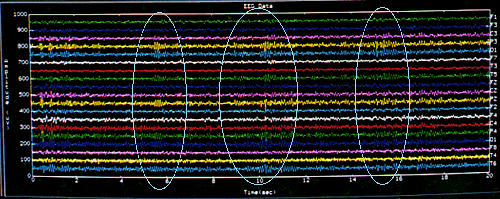
| The image above represents 20 seconds of raw EEG data (squiggly lines below) which includes 4 alpha bursts rendered as spatiotemporal isosurfaces (top). If you look closely at the areas in the raw data (bottom) which are circled in light blue, you can see the alpha bursts as an increase in activity, but it requires considerable visualization skills to render in one's mind what is easily rendered with the right software. The deep blue flow lines in the isosurface image represent the gradient (direction of maximum first derivative), enhancing the dynamic nature of this information. |
Jeff's Home